Finance leaders can’t improve what they can’t measure.
Yet, most AP automation projects still lack clear KPI models making ROI vague and adoption harder to justify.
This guide lays out the essential metrics every AP team should track, with real-world benchmarks and a framework to calculate ROI.
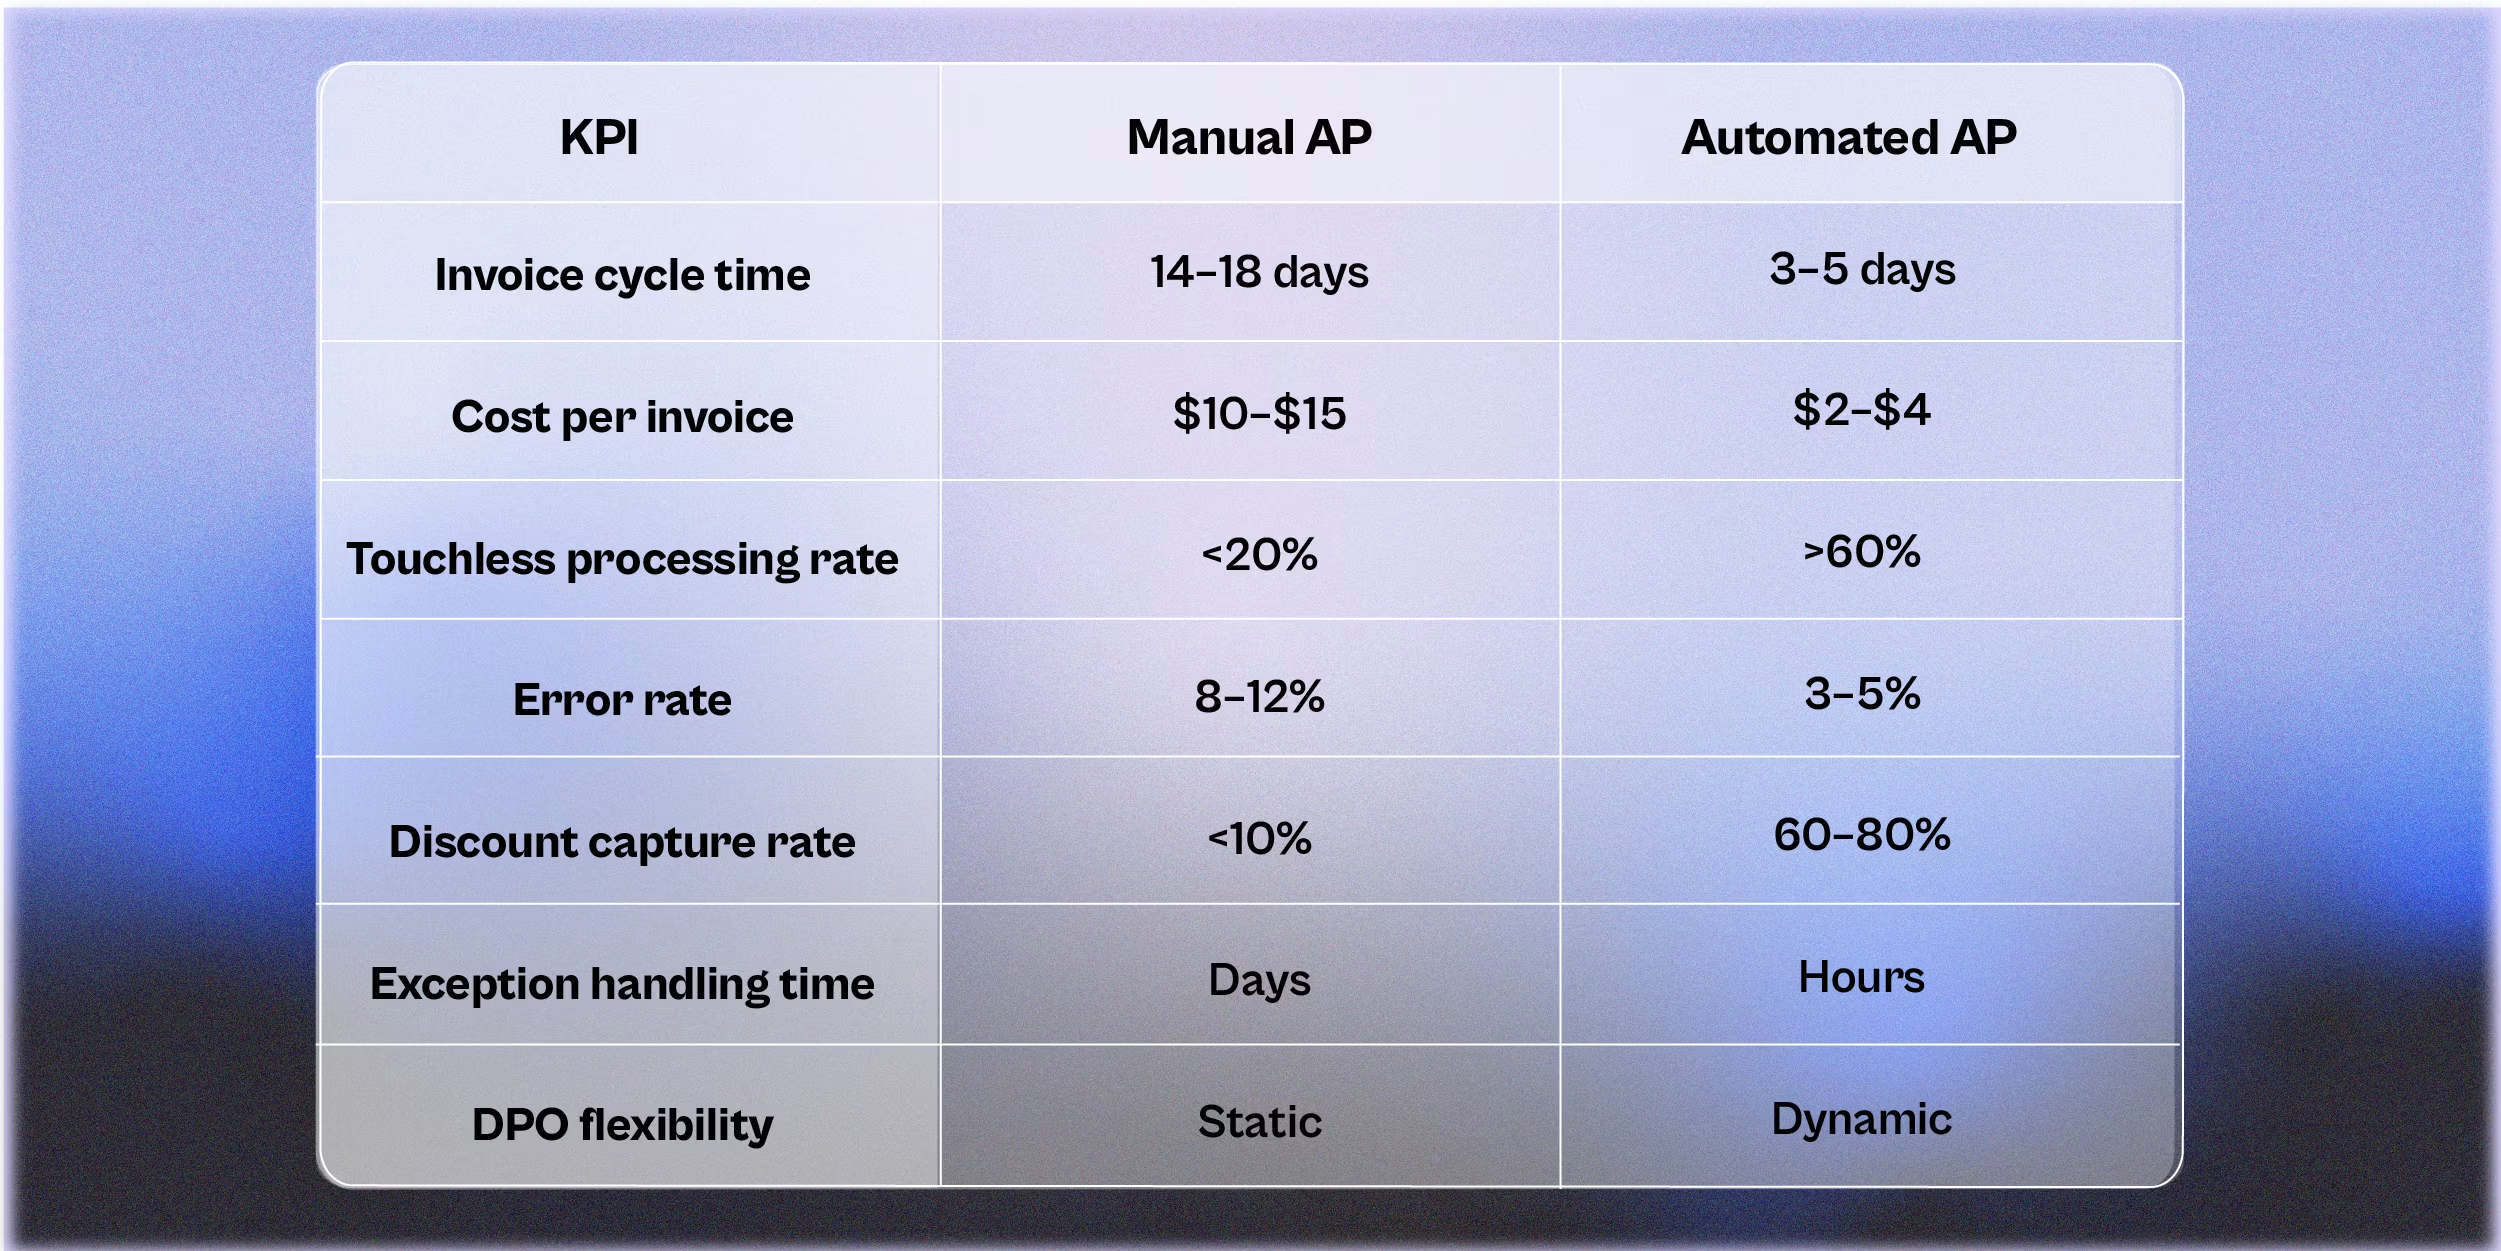
What Makes AP KPIs Different
AP performance isn’t just about speed, it’s about accuracy, visibility, and control.
The right KPIs reflect:
- Operational efficiency (cycle time, invoice throughput)
- Financial performance (cost per invoice, early payment discounts)
- Risk reduction (fraud, duplicate payments, error rates)
- Strategic alignment (touchless % and DPO flexibility)
Without standardized tracking, AP becomes a black box.
The KPI Model: Metrics That Matter
Strategic Impact: KPIs That Move the Needle
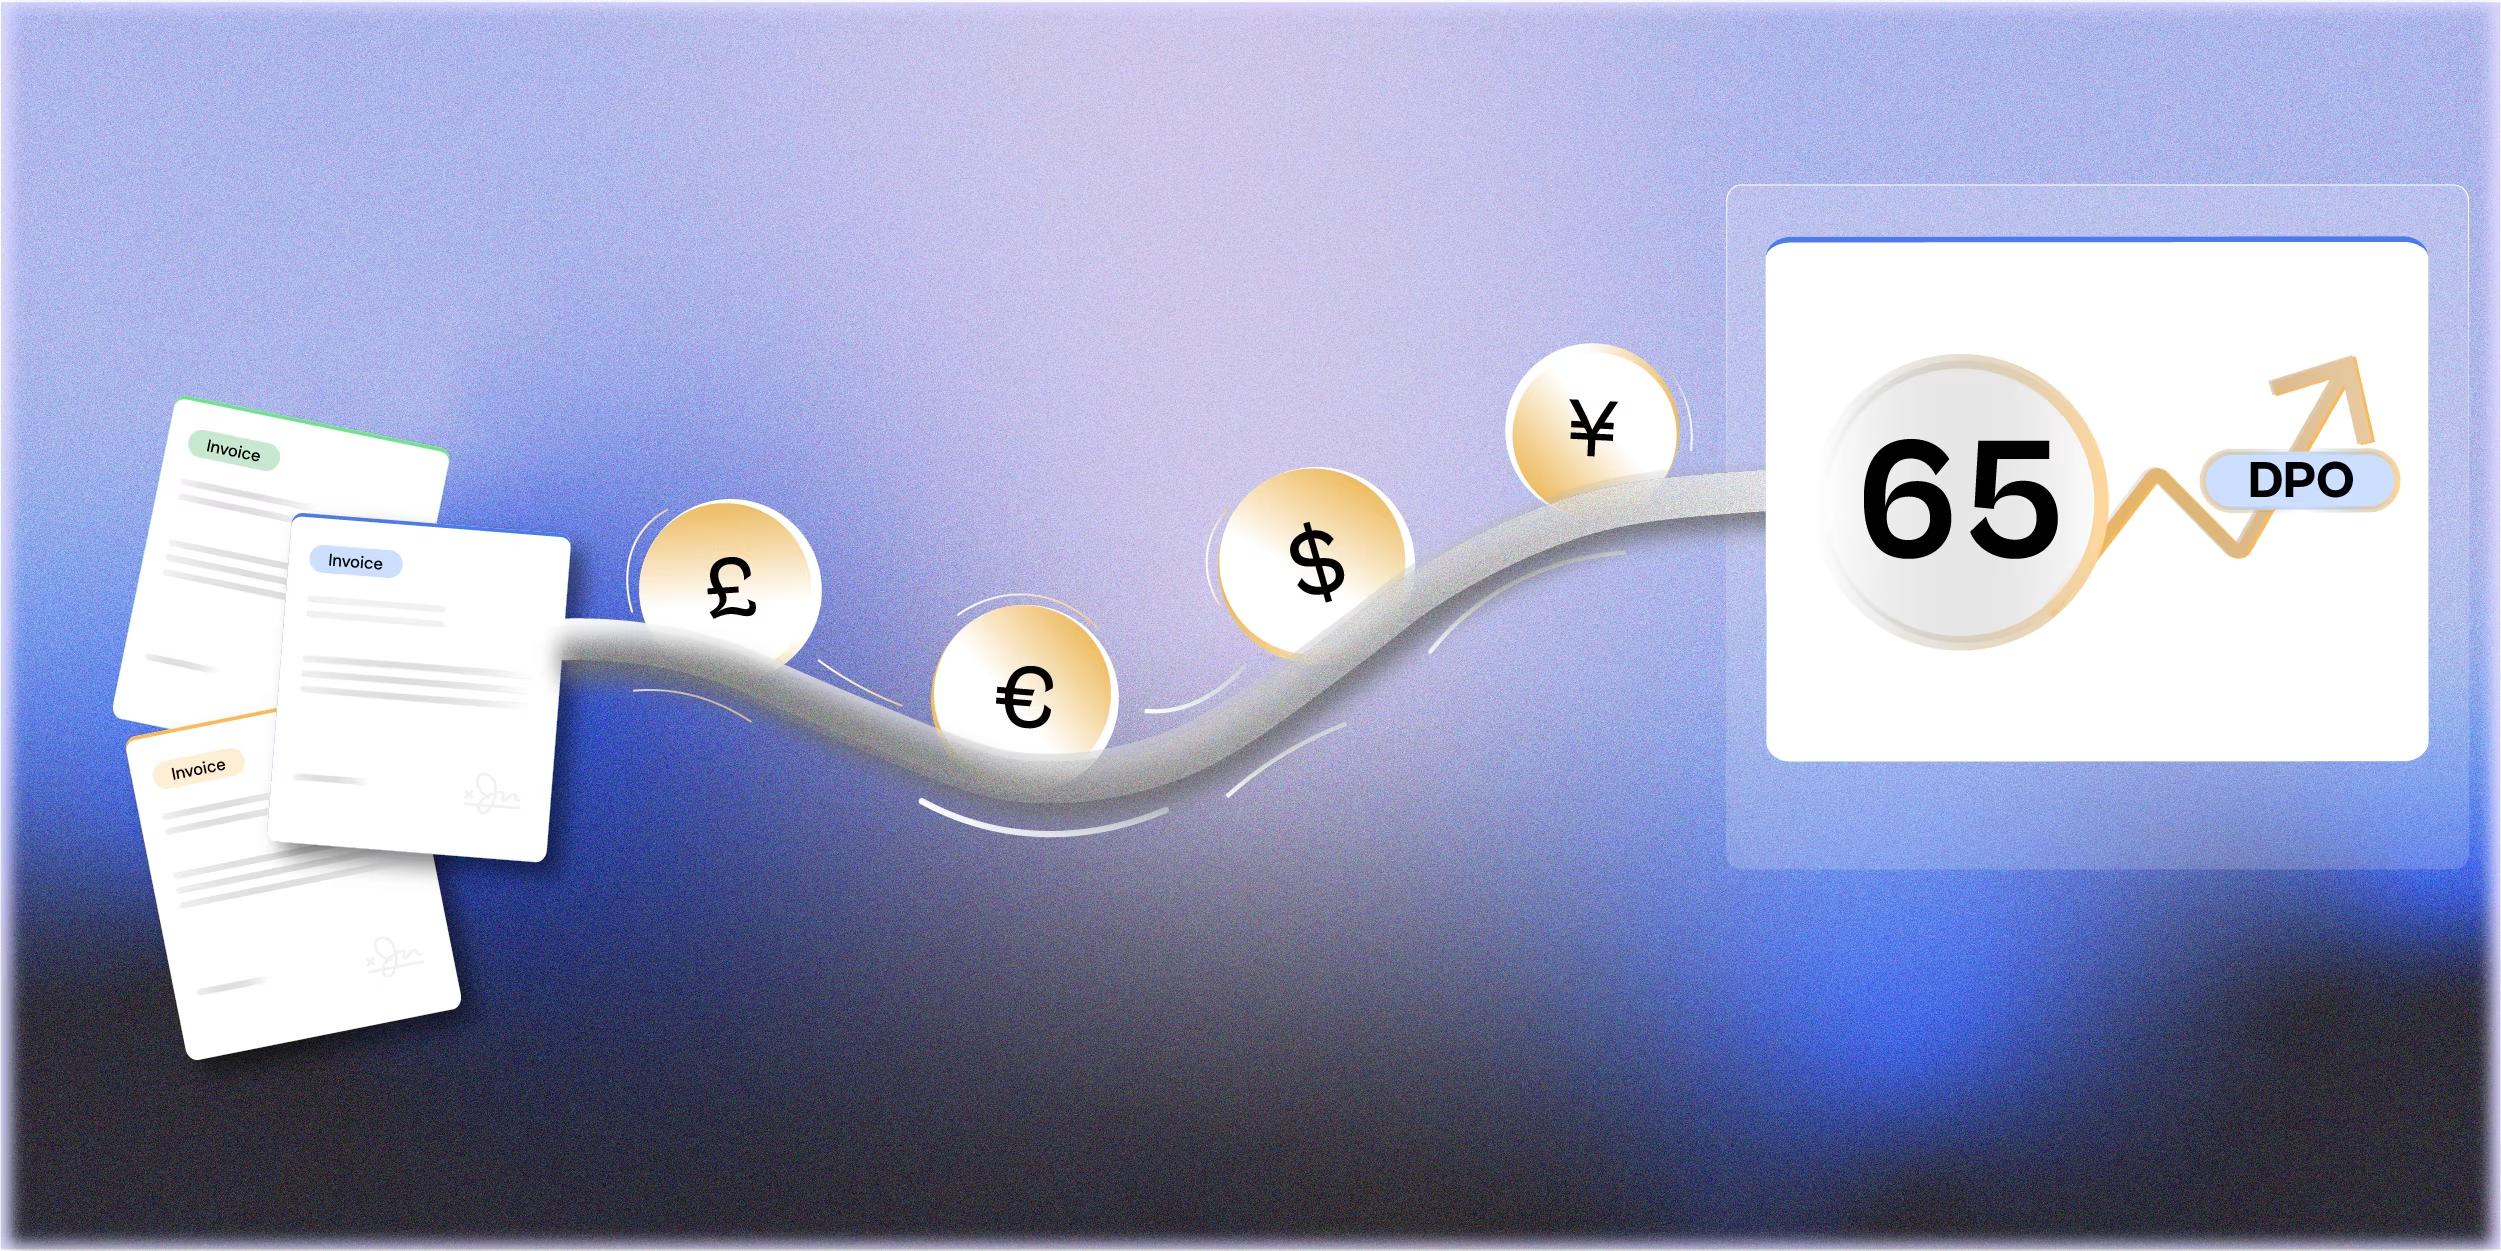
1. Working Capital Gains
Every 5-day DPO improvement = ~$140K in freed-up cash per $10M AP spend.
AP automation gives you policy-based DPO flexibility.
2. Early Payment Discounts
At 2% savings and 60% capture rate:
→ $600K benefit on $50M AP volume.
3. Fraud Prevention
3-way match and GRN validation reduce overpayment risk by 60–70%.
ROI Benchmarks: Justify the Business Case
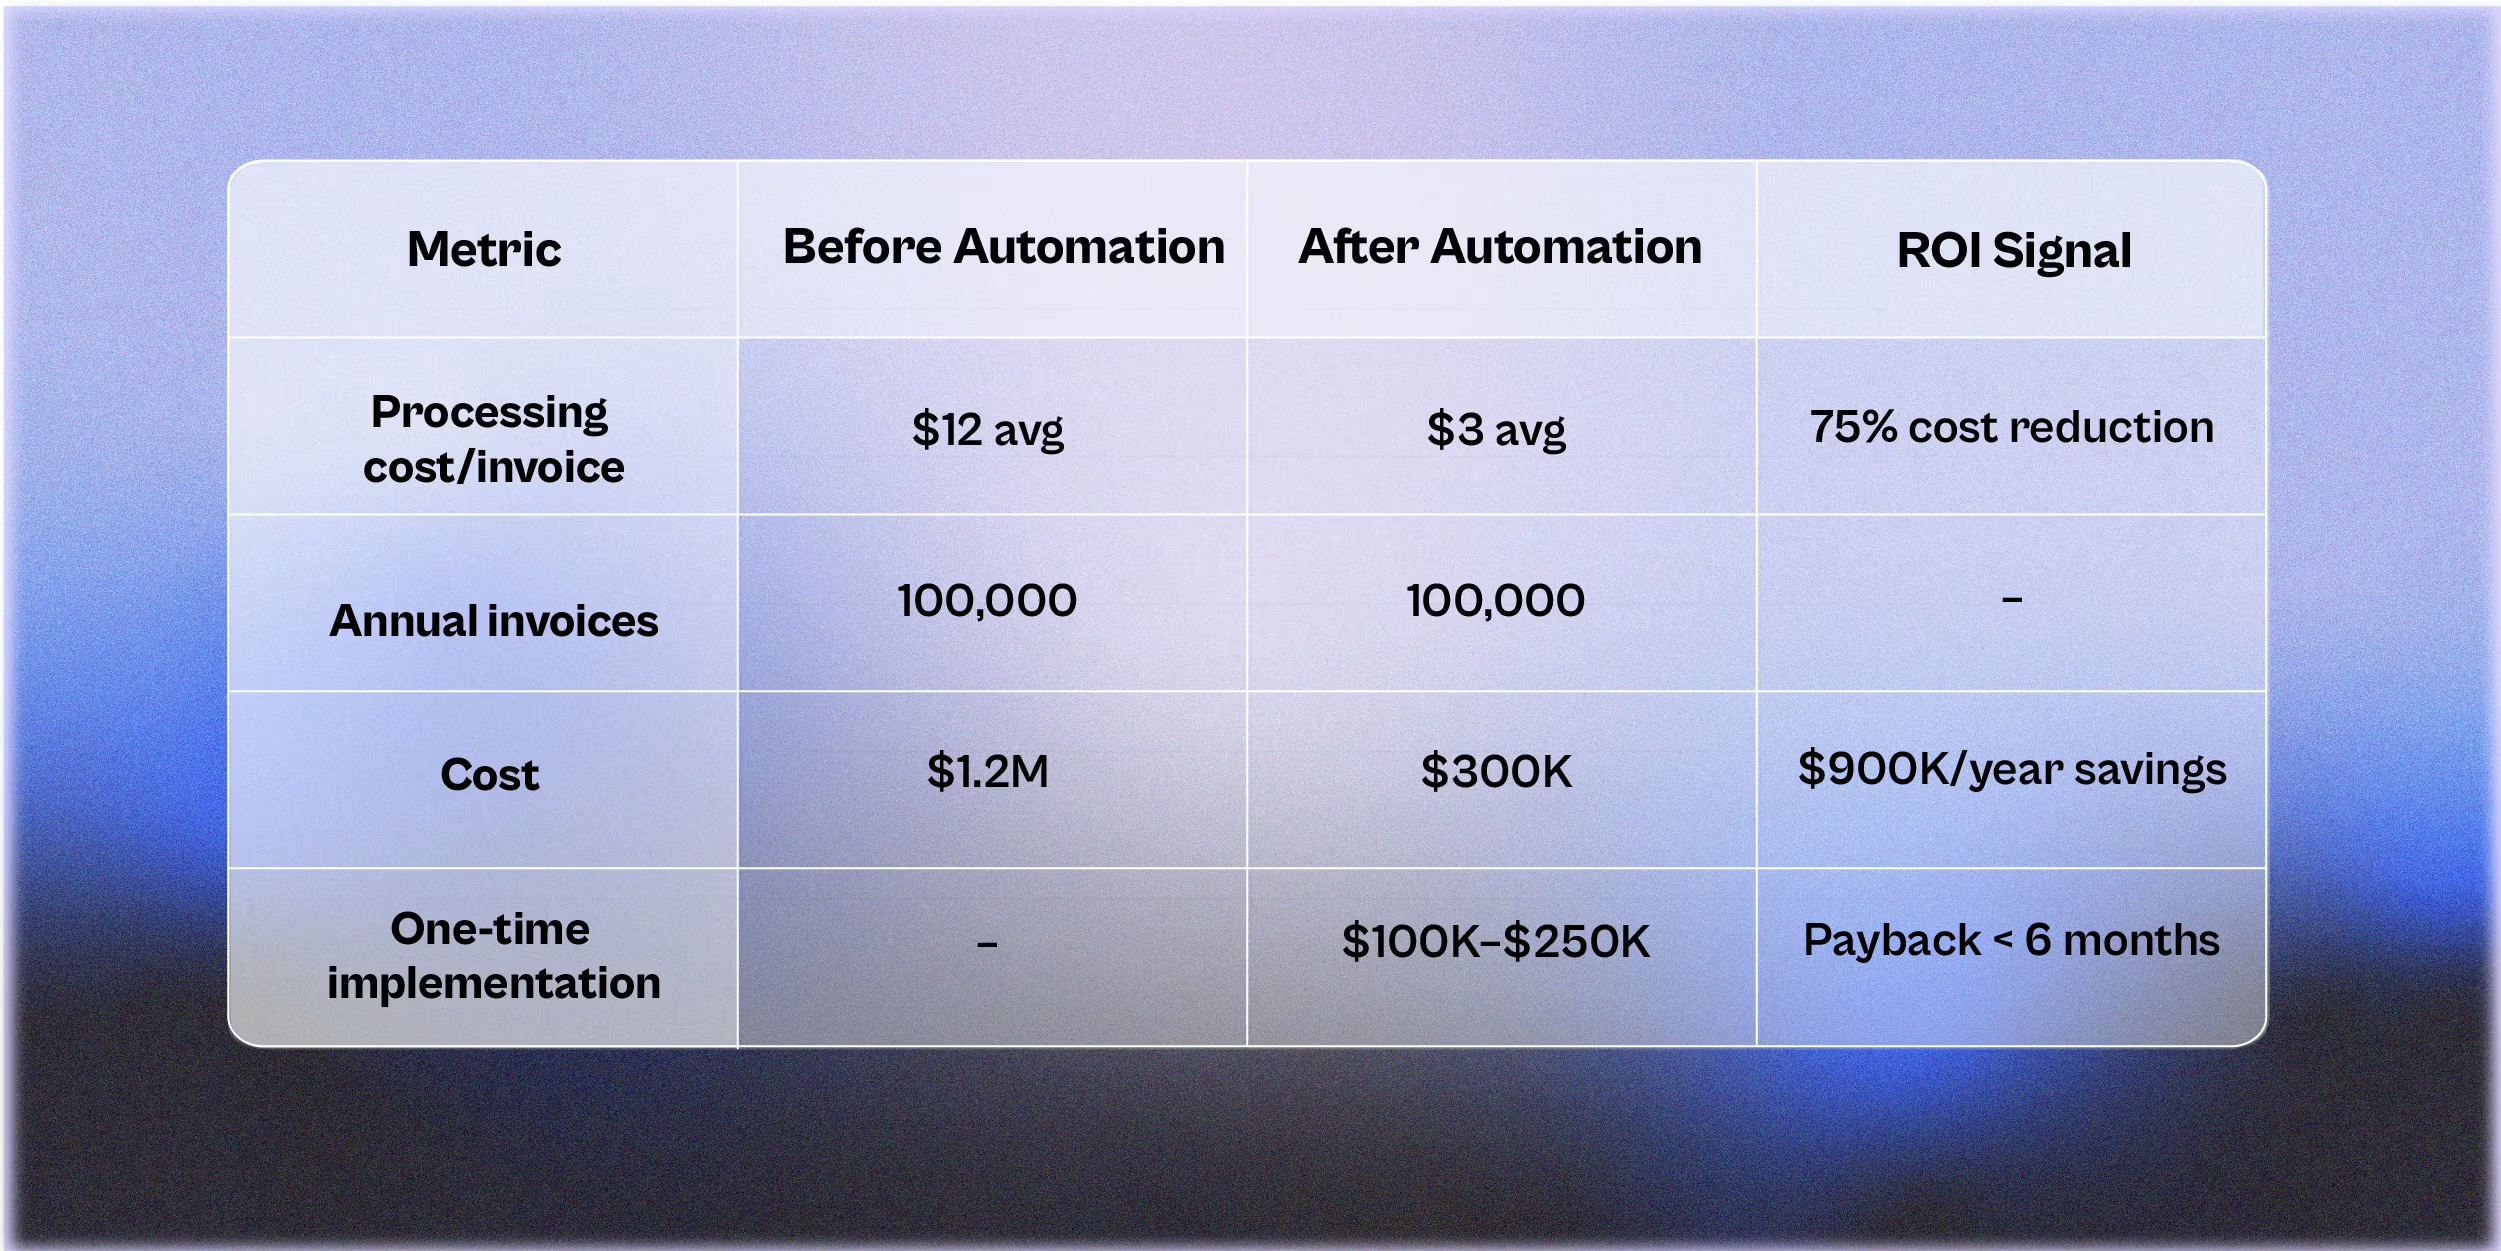
Add indirect benefits:
- 20–30% time savings for AP staff
- Higher accuracy = fewer supplier disputes
- Real-time cash visibility = better FX decisions
The ROI from AP automation isn’t hypothetical, it’s measurable.
By tracking the right KPIs from day one, finance teams can demonstrate impact, defend budgets, and scale smarter.
Don’t just automate. Track it. Prove it. Optimize it.
Book a Demo
See how Finofo helps mid-market teams slash invoice costs, boost DPO, and track AP performance in real time