For finance teams in mid‑market (100‑1,000 employees) companies, automating accounts payable (AP) is no longer optional—it’s strategic. With pressures on cashflow, supplier relationships and staffing, AP automation provides a pathway to reduce cost, risk and manual burden. But adoption isn’t uniform: regional differences between Canada and the U.S. are emerging. In this article, we compare the trends, drivers and ROI benchmarks of AP automation in Canada vs the U.S., so you can assess where your organisation stands and what to prioritise next.
The automation gap: Canada vs U.S.
U.S. – a head‑start market
The North‑American AP automation market is already sizable. A recent market‑research report estimated the global market at USD 3.07 billion in 2023 and projected it to reach USD 7.1 billion by 2030, with North America accounting for ~33 % share in 2023.
Within North America, the U.S. is expected to dominate adoption due to stronger digital maturity, higher investment in automation solutions and larger enterprise footprints.
For example, a 2025 article noted that only 9 % of AP departments globally are fully automated, but two‑thirds expect to be fully automated by 2025.
Canada – catching up, but unique challenges
Canada’s AP automation activity is growing but typically trails the U.S. in adoption, scale and vendor ecosystem maturity. For example, one Canadian‑focused consultancy article flagged the challenge of diverse invoice formats and “human in the loop” steps still required.
Key difference summary
- Scale & maturity: U.S. mid‑markets more frequently have established AP automation programmes; Canadian counterparts often still wrestle with manual processes.
- Vendor/solution ecosystem: More U.S.‑based vendors and domestic services focused on U.S. regulations. Canadian finance teams sometimes must adapt U.S.‑centric tools or deal with local‑specific regulatory/tax differences.
- Regulatory & process complexity: Canada presents some unique tax, bilingual (English/French) and provincial regulatory layers that can slow standardisation.
- Budget & investment cycle: U.S. mid‑markets may have slightly greater budgets for digital finance transformation; Canadian organisations often adopt incremental approaches.
Drivers & pressures shaping AP automation
Shared drivers
- Manual invoice processing remains a major drag: According to a global AP automation trends report, 63 % of AP teams spend more than 10 hours/week on invoice processing; 66 % still manually enter invoice data into ERP systems.
- Talent constraints: With finance and AP teams under pressure from staffing shortages and turnover, automation helps relieve repetitive work and allow higher‑value focus.
- Supplier/ vendor relationships: Timely payment and transparency matter more post‑pandemic. Automation improves visibility and control.
- Technological enabling: Cloud deployment, OCR/IDP, AI and RPA are stepping stones in mid‑market AP automation. Reports highlight AI/ML as upcoming differentiators.
Regional nuances
In the U.S.:
- Larger mid‑market firms are increasingly looking beyond core invoice capture to full procure‑to‑pay automation and supplier portals.
- Fraud, compliance and cost pressures (especially in sectors like healthcare, retail) are strong motivators.
- Cloud‑first solutions predominate; on‑premise is decreasing.
In Canada:
- More conservative transformation pace: Many firms are still working to digitise invoice capture or approval workflows before automation of payments.
- Specific regional regulatory/tax complexity, bilingual requirements and smaller domestic vendor pools can slow standardisation.
- Managed‑service models (outsourced AP automation) are more frequently used as stepping‑stones. The consultancy article mentions “next generation finance automated managed services” as a viable approach for Canadian firms.
Strategic implications for mid‑market finance teams
- Prioritise “touchless” processing: Rather than only automating individual tasks, aim for end‑to‑end workflows (invoice → matching → approval → payment) to unlock supplier relationship and cost benefits.
- Regional readiness matters: For Canadian companies, evaluate local regulatory/tax/bilingual requirements early when selecting AP automation vendors. U.S. vendors may not always have Canadian‑specific modules without extra cost or customisation.
- Choose cloud and scalable tools: Mid‑market firms benefit from SaaS models with cloud deployment, which reduce IT burden and accelerate time‑to‑value
- Focus on data & supplier analytics: Once core automation is in place, shift to analytics: supplier spend, payment performance, exception trends. Firms who do this move from cost‑centre to strategic.
- Budget for change‑management and process redesign: Especially in Canada, integrating new tools requires reworking approval workflows, vendor onboarding and training. Without that, ROI suffers.
- Benchmark value: track key KPIs: Cycle time, cost per invoice, exceptions rate, vendor & staff satisfaction. Use these to measure progress and build the business case.
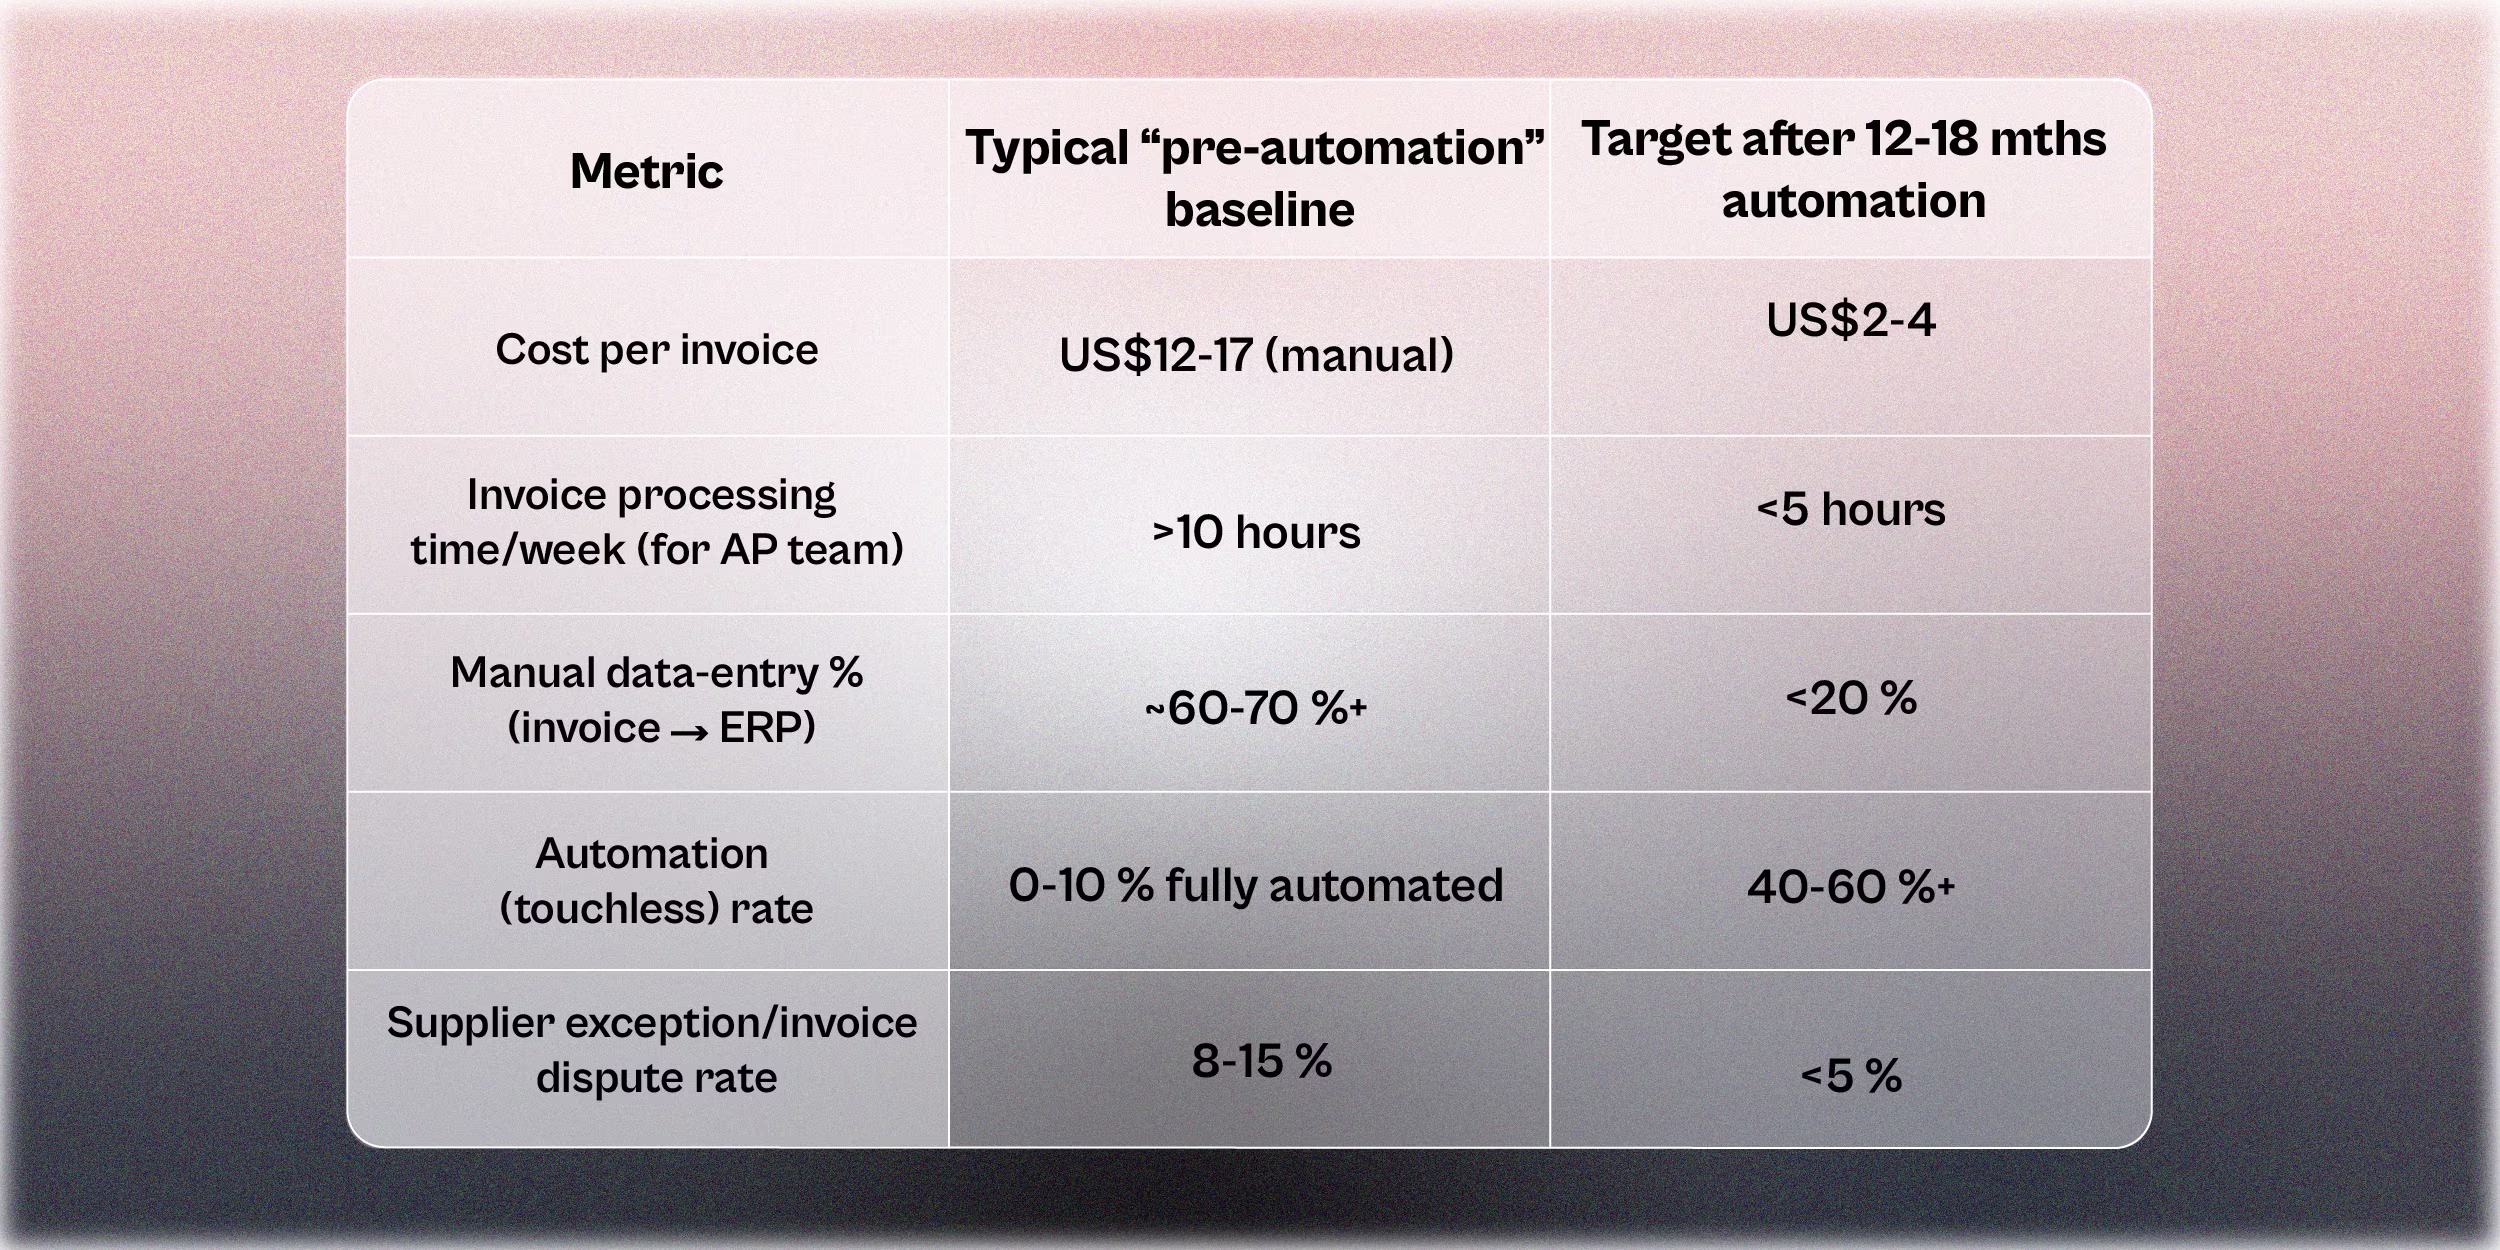
ROI benchmarks
Below is a table of typical mid‑market benchmarks for AP automation in North America.
For companies in North America, automating accounts payable is no longer a “nice to have”, it’s a strategic imperative. While the U.S. leads in scale and maturity of AP automation, Canadian firms are rapidly catching up with regional nuances that require deliberate planning. The key for AP and finance leaders is to prioritise end‑to‑end workflows, choose scalable cloud‑first solutions, account for local regulatory/operational complexity, and benchmark progress using clear KPIs. Done right, AP automation offers meaningful cost savings, process speed, better supplier relationships and elevated strategic value for the finance function.
Book a demo → Learn how Finofo streamlines AP automation across mid‑market North American companies.